Patient-Centric Data Insights
Data Understanding
The healthcare dataset includes features like Date, ID, Gender, Age, Race, Moment (AM/PM), Weekday/Weekend,
Admin Flag (Patient/Non-Patient), Department Referral, and Satisfaction Score. These fields allow for a detailed
look at visitor demographics, visit timings, and department engagement, creating a strong basis for trend analysis
and operational insights.
Data Preprocessing
Data Normalization and Imputation
In the Power Query Editor, the dataset underwent an ETL (Extract, Transform, Load) process, which included normalization
by splitting tables to enhance data organization and clarity. Missing values were addressed through imputation techniques,
ensuring that the dataset remained robust and reliable for analysis while maintaining consistency across various features.
DAX Calculations and Data Modeling
Data Analysis Expressions (DAX) were utilized to create calculated fields for aggregation, allowing for sophisticated
analysis of the healthcare data. This facilitated effective data modeling by establishing relationships between tables,
enabling comprehensive insights and enhancing the overall interpretability of the dashboard.
Visit Trends and Patterns
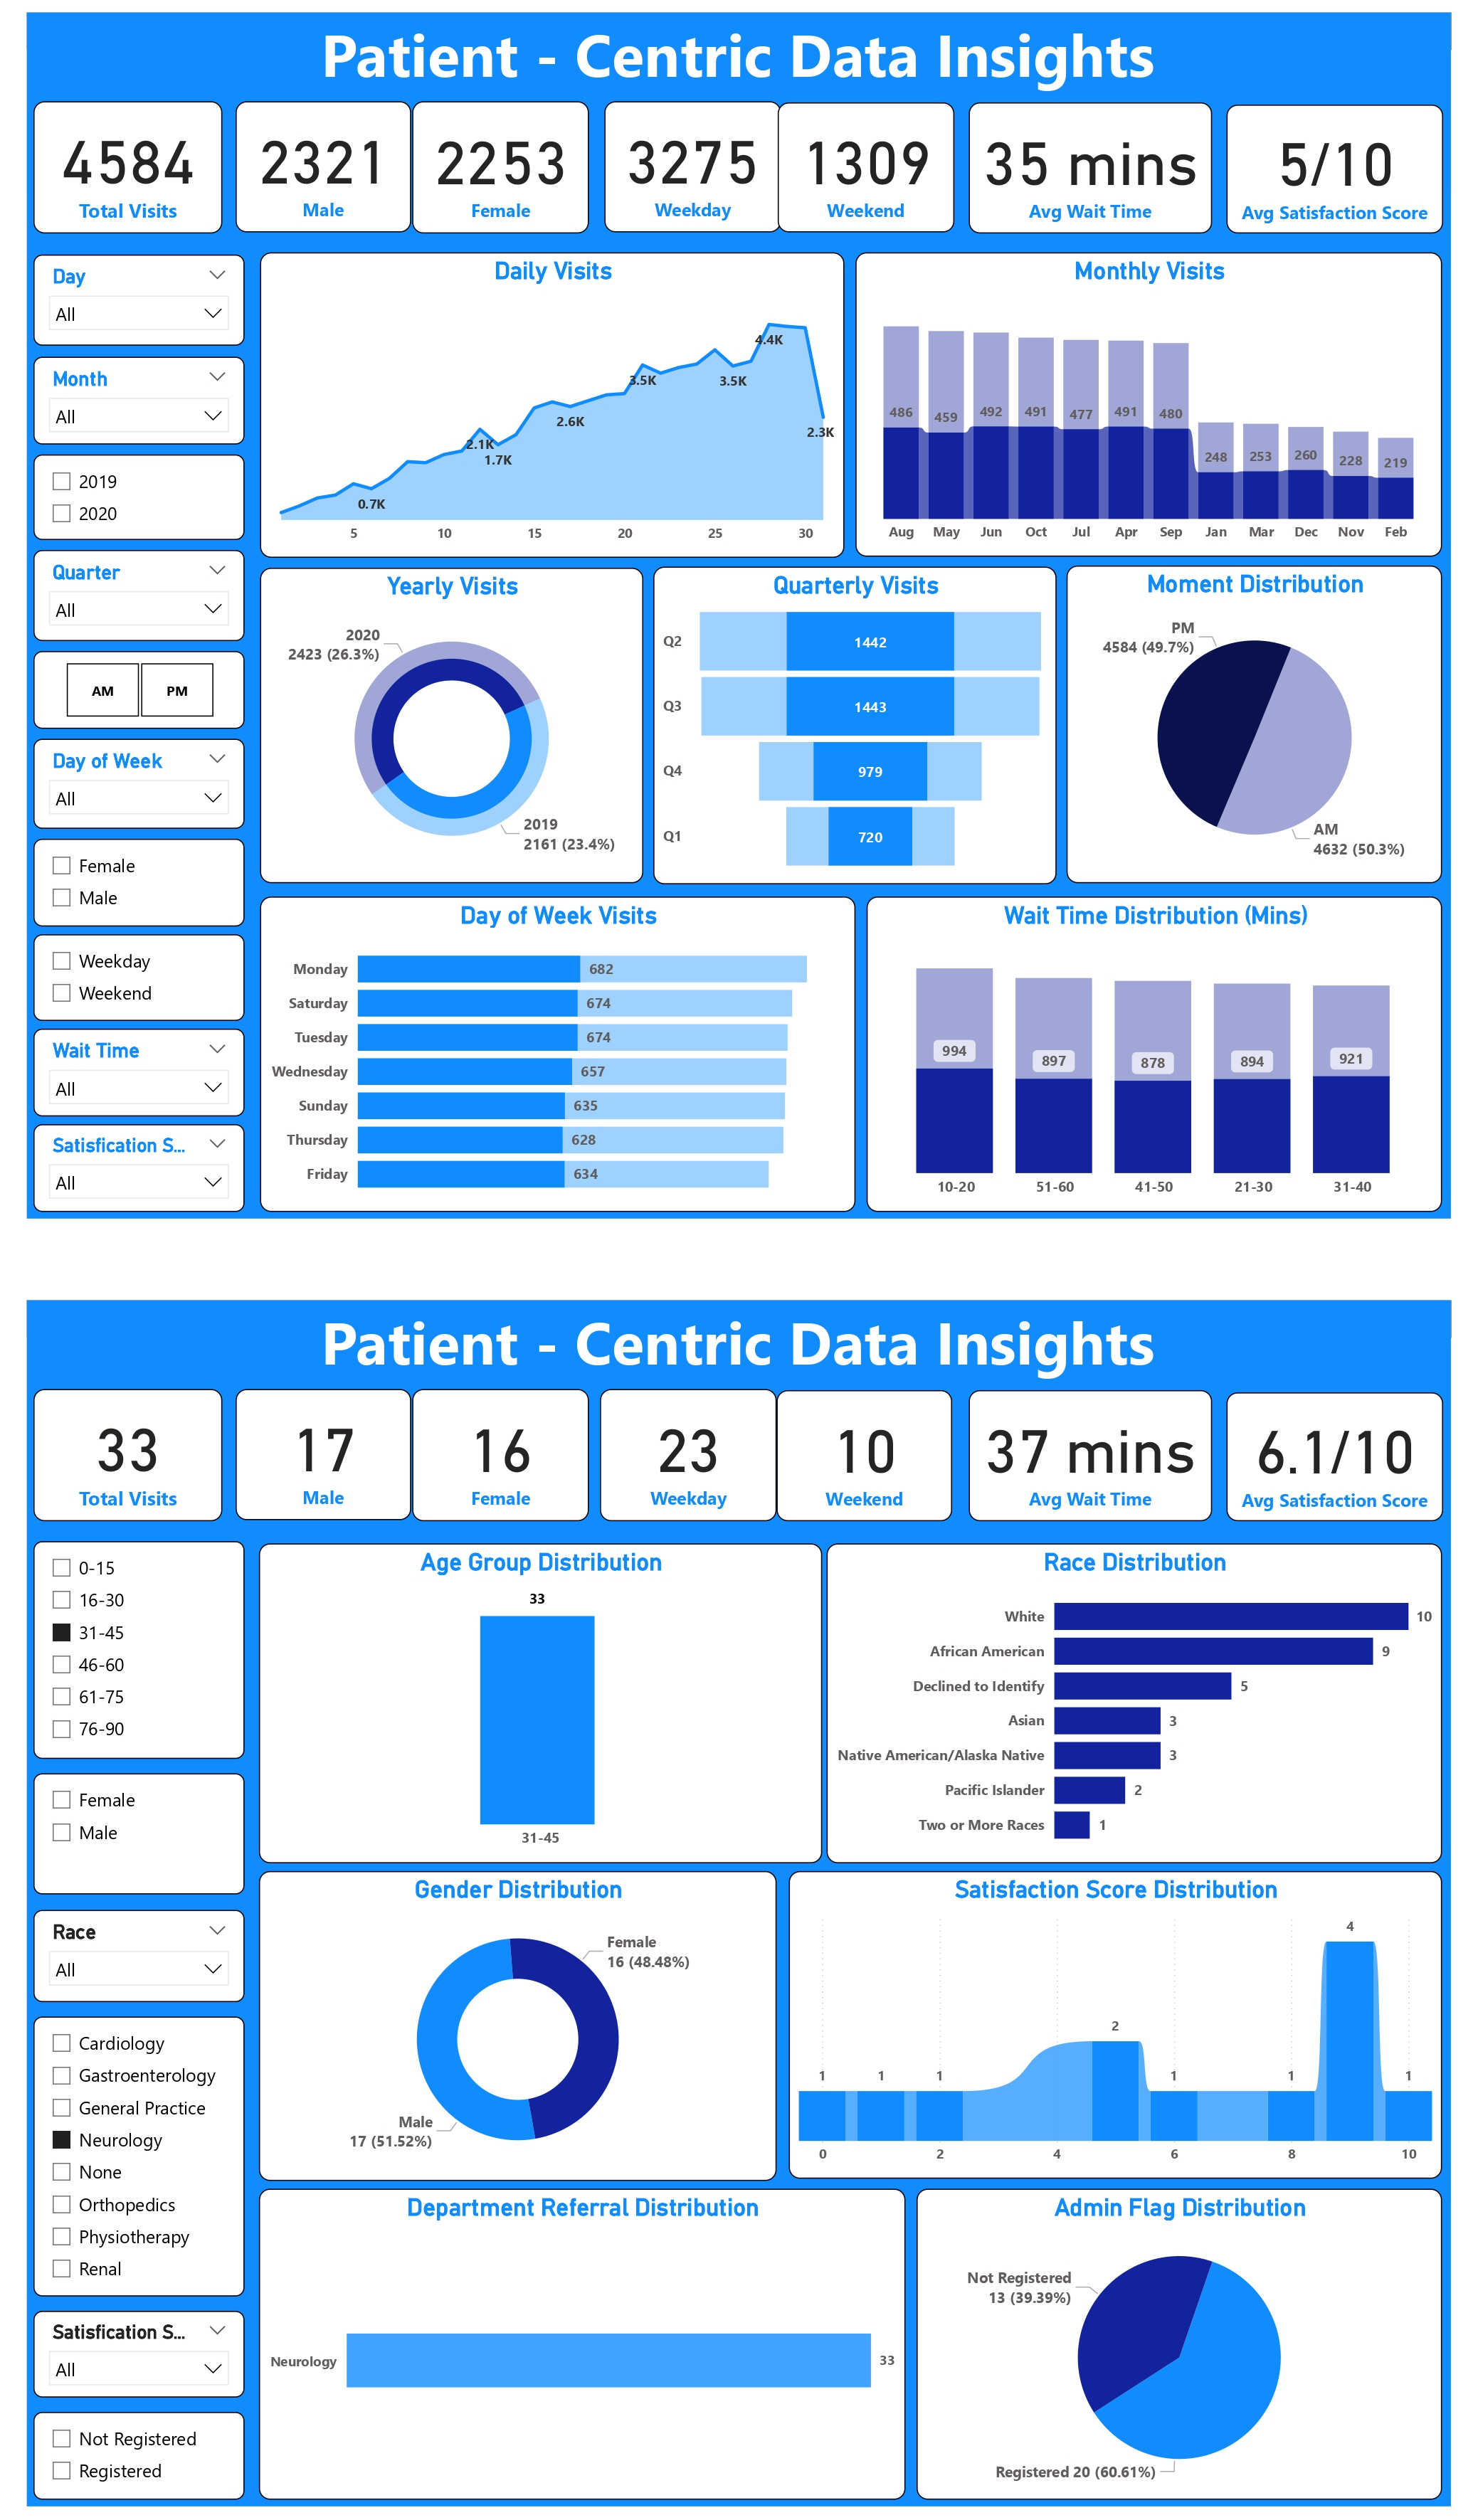
Daily Visits
The daily visitor trend shows a gradual increase from the start of each month, peaking towards the end, and then dropping
on the last day. This suggests a higher influx of visitors in the final week of every month.
Monthly Visits
From April to October, there was a noticeable increase in visitor counts, particularly during the summer and rainy seasons.
This trend indicates that seasonal factors significantly impact hospital traffic.
Yearly Visits
The visitor counts increased by 5.8% from 2019 to 2020, suggesting either an increase in health issues or growing trust in
the hospital’s services. This rise may reflect both higher demand for healthcare and improved patient satisfaction.
Quarterly Visits
The second and third quarters exhibited visitor volumes that were 53.9% higher than the first and fourth quarters. This
indicates that mid-year periods are busier, potentially due to seasonal illness peaks.
Time-Based Distribution
Moment Distribution
Visitor flow is evenly split between AM and PM hours, with a slight 0.6% increase during AM visits. This indicates steady
demand throughout the day, likely from a mix of appointments and walk-ins.
Day of Week Distribution
Visitor volumes peak on Mondays and Wednesdays, while Fridays have the lowest counts. This suggests a mid-week preference
for hospital visits, possibly due to increased medical needs.
Weekday vs Weekend
Weekday visits are 148.83% higher than weekends, reflecting significant weekday traffic. This large difference is due to
fewer staff or reduced hours on weekends, encouraging visits during the week.
Visitor Wait Time Analysis
Average Wait Time
On average, visitors wait about 35 minutes, with 90.9% experiencing waits between 20 to 60 minutes. This indicates a
significant area for potential process improvement in reducing wait times.
Short Wait Times
Only 9.1% of visitors experience shorter wait times of 10 to 20 minutes. This low percentage highlights a clear opportunity
to enhance service speed and overall patient satisfaction.
Demographic Insights
Age Group Distribution
Visitors of all ages (0 to 75) show similar frequency, while the 75+ age group constitutes only 5.04%. This may reflect either
fewer visits or a smaller demographic within this age range.
Race Distribution
White and African American visitors comprise the majority, with Asians at a moderate count. Pacific Islander and Native American
groups together account for 11.37%, reflecting a diverse patient population.
Gender Distribution
Male visitors outnumber females by 4.86%, while the "Not Specified" category represents a minimal 0.26%. This slight gender
disparity highlights the need for targeted engagement strategies.
Satisfaction and Departmental Insights
Satisfaction Score Distribution
The average satisfaction score is 5 out of 10, indicating that most visitors have a neutral or average perception of the services,
showing room for quality improvement.
Department Referrals
General Practice and Orthopedics patients account for 30.75%, while other departments, including Physiotherapy and Cardiology,
represent 10.64%. Notably, non-referred patients constitute a substantial 58.67% of total visitors.
Admin Flag Distribution
50.04% of visitors are fully registered patients, while 49.96% are either visitors or individuals not registered for treatment.
This indicates a significant portion of the hospital's traffic consists of non-registered individuals.